Current projects include creating models of airborne pollen at municipal scales in Detroit for wind-pollinated trees and ragweed, at regional scales in Texas for Ashe juniper pollen (the cause of 'cedar fever') , and at continental scales in the United States and Canada for wind-pollinated trees. We trace the contributions of individual plants to airborne pollen concentrations and exposures, allowing for:
- more informed plant management decisions in cities;
- improved pollen forecasts so people can reduce their exposures and better manage their allergy medications; and
- better epidemiological analyses through improved estimates of allergen exposures.
urban-scale pollen models
|
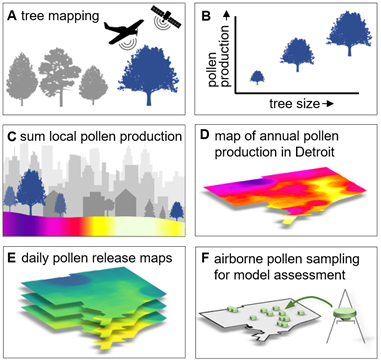
In this project, we leveraged methods from plant ecology and remote sensing to understand and predict airborne pollen concentrations on scales of hundreds of meters to kilometers. Specific projects include:
|
|
rEGIONAL-scale pollen models
|
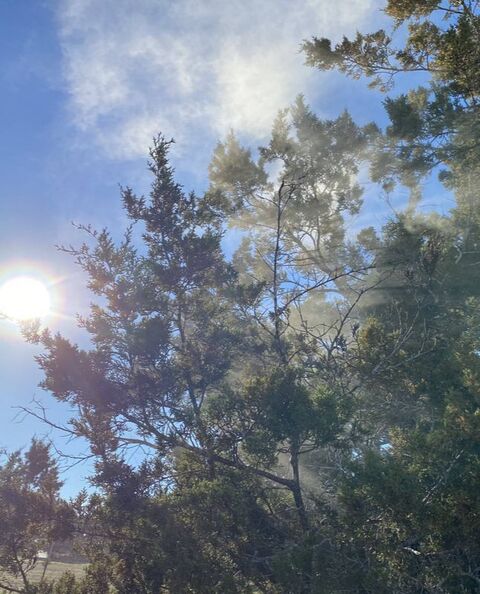
Ashe juniper (Juniperus ashei) is one of the most abundant trees in central Texas and it is releases the infamous allergenic pollen that causes 'cedar fever.' The goal of this research is to create process-based models of airborne pollen concentrations for J. ashei. This includes:
|
|
Continental-scale pollen models
We are starting to build continental scale models of airborne pollen based on maps of plant locations and abundance. This project will leverage National Phenology Network observations, plant distribution and abundance models, local-scale temperature metrics and phenology modeling, laboratory experiments to better understand the conditions of pollen release, and atmospheric dispersion modeling. We're actively searching for collaborators on this research.
Other projects
|
Allergenic pollen is just one of many ways that people interact with plants. We readily and enthusiastically apply our knowledge and skillsets to other topics, including ecosystem services. For example, plant location, structure, and identity can be used to create better estimates of shading from trees, an important ecosystem service in Austin! This physically accurate animation of shade on July 22, 2020 in Hyde Park is based on LiDAR, aerial imagery, and is coded in R using lidR and rayshader.
|
|
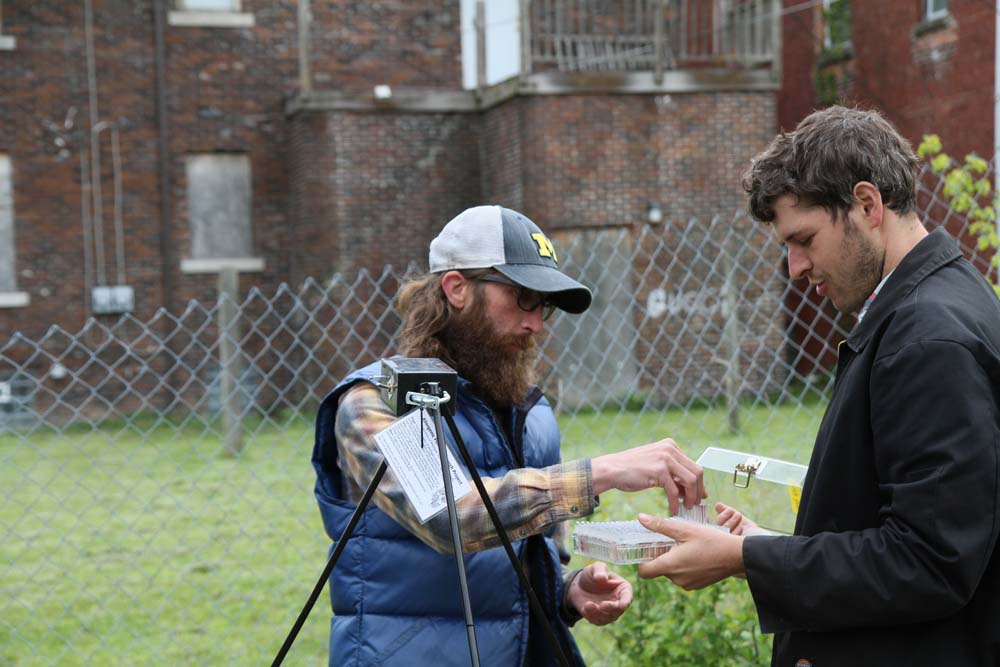
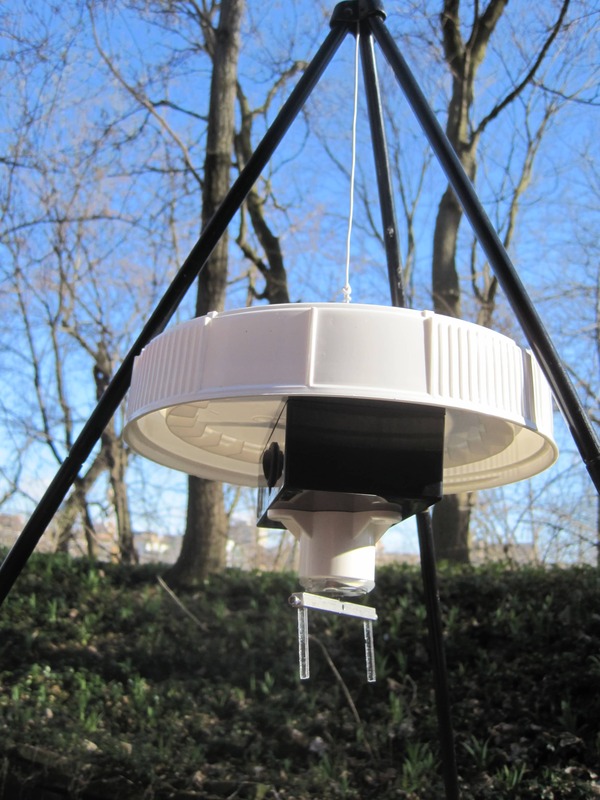
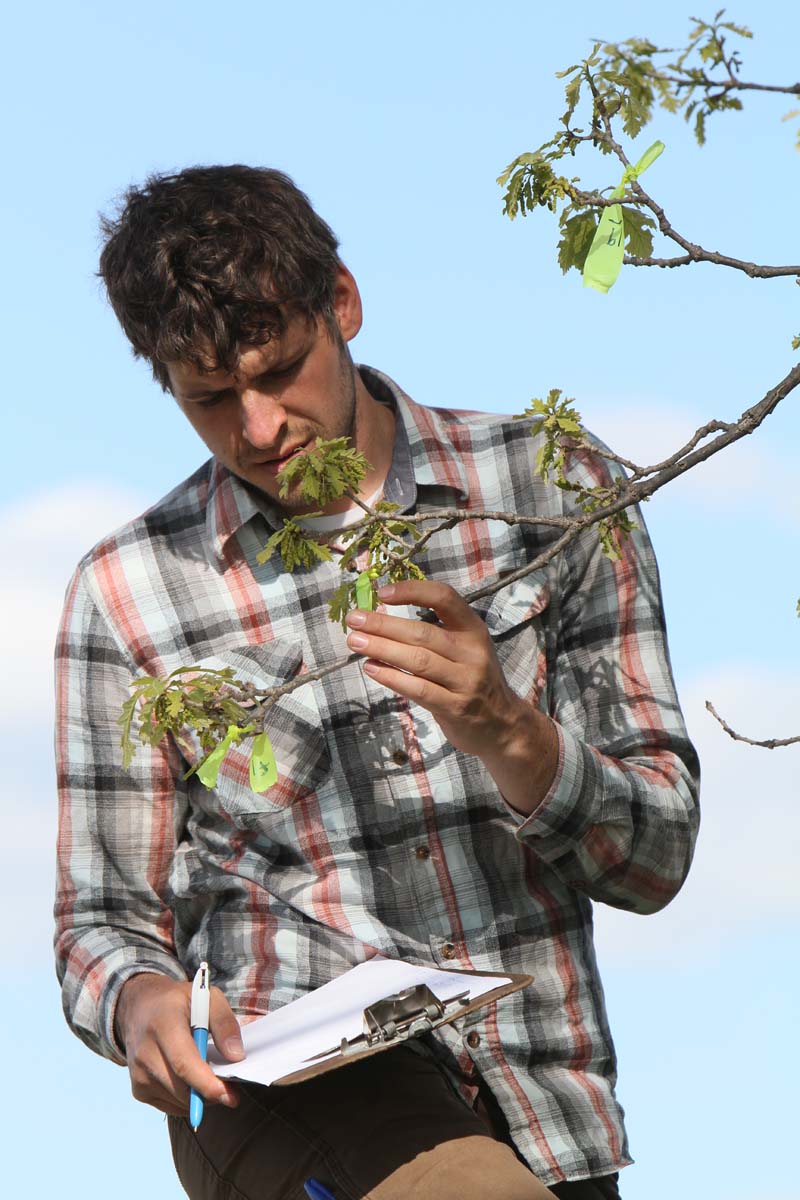
What our work looks like |
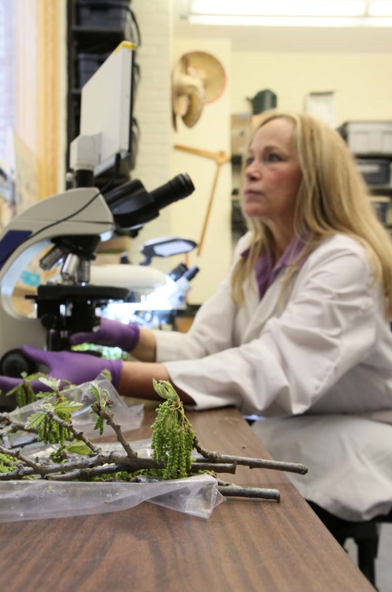
The plants |
|
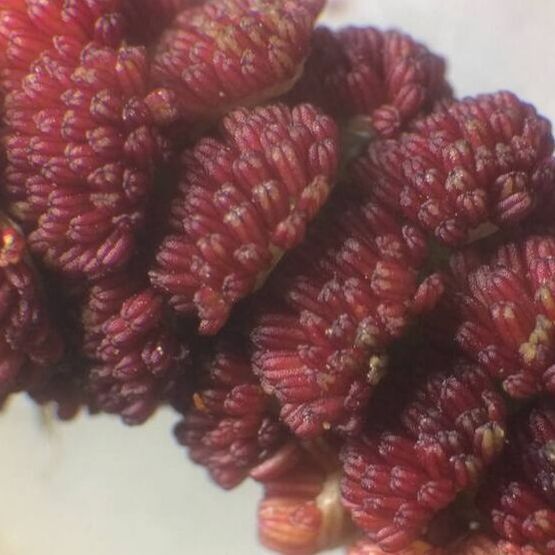
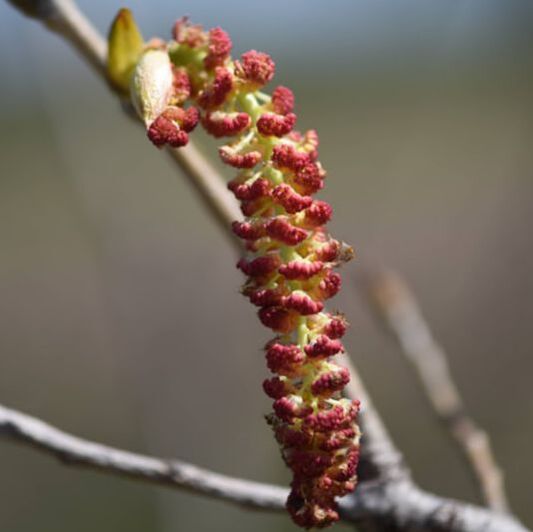
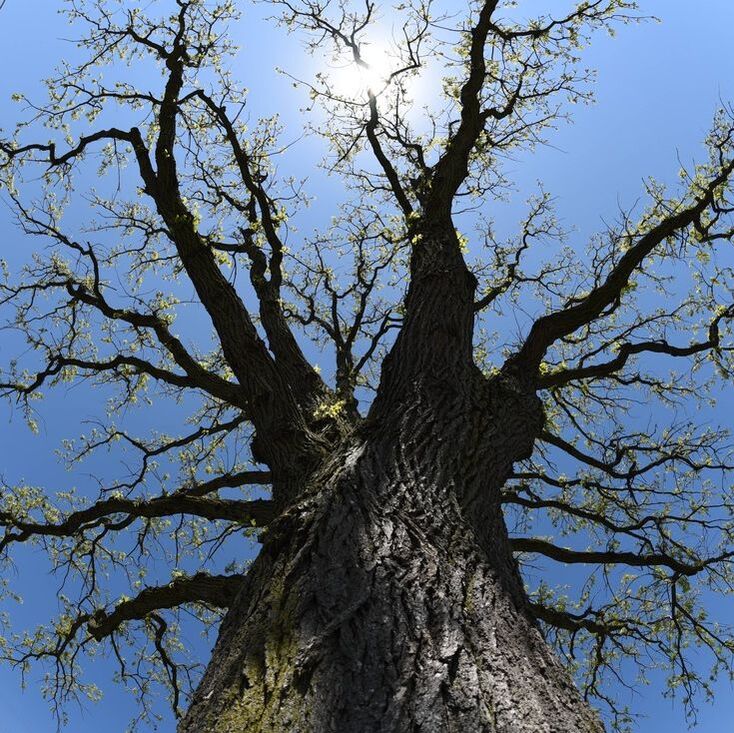
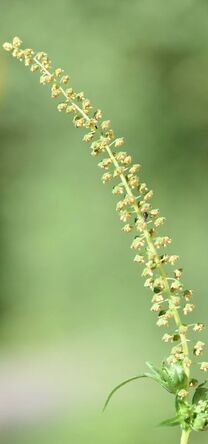
We work with temperate wind-pollinated plants, from oak trees to junipers and ragweed.
|
|
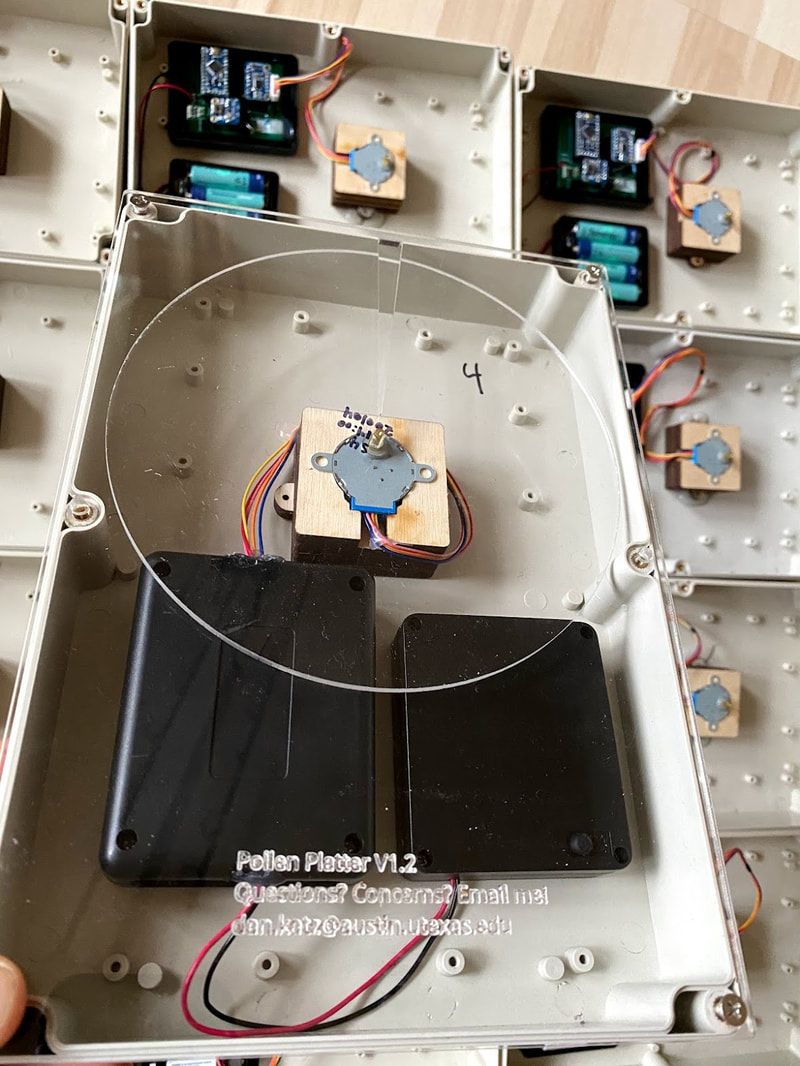
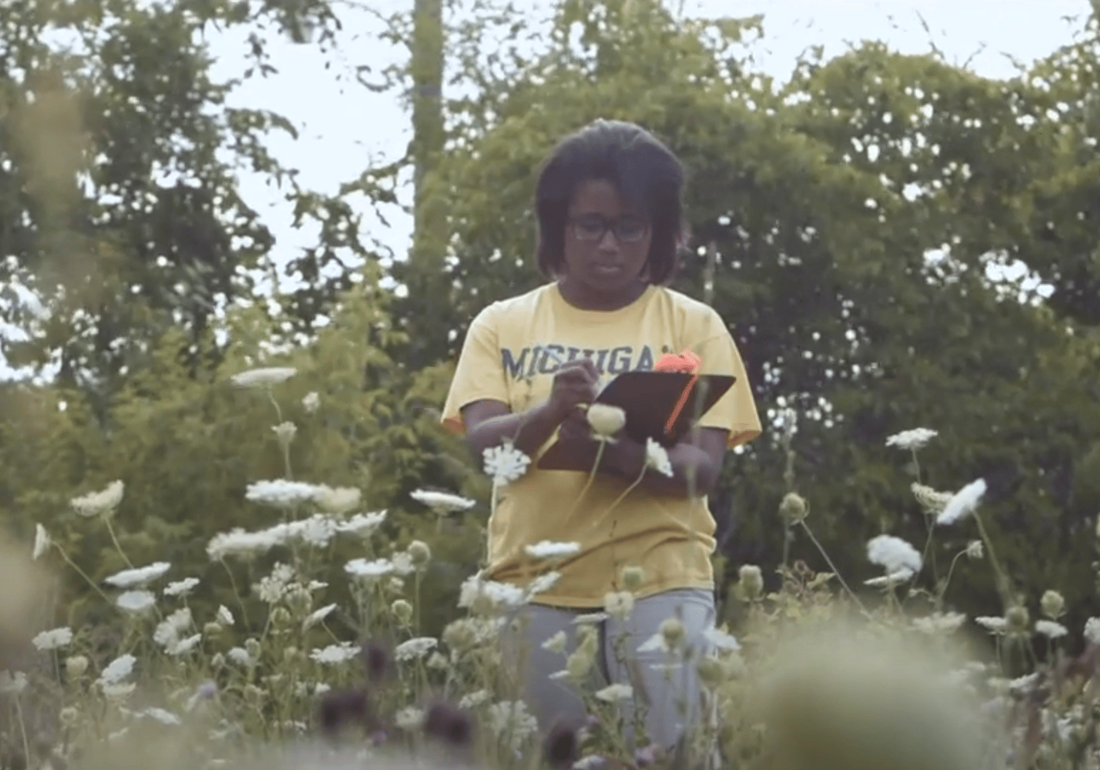
the ProcessOur lab uses methods from plant ecology, remote sensing, Bayesian statistics, citizen science, atmospheric dispersion modeling, engineering, and epidemiology. We work at scales from microns to thousands of kilometers.
|

the models
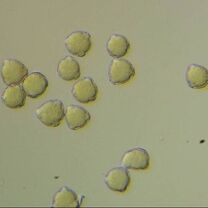
We use remote sensing imagery collected from airplanes, satellites, and drones to map plants, their characteristics, and their habitats. We also use environmental datasets (self-collected and publicly available) to understand and predict plant phenology. This knowledge is combined to estimate pollen release and inform atmospheric dispersion modeling efforts, which we then assess empirically.